Observable
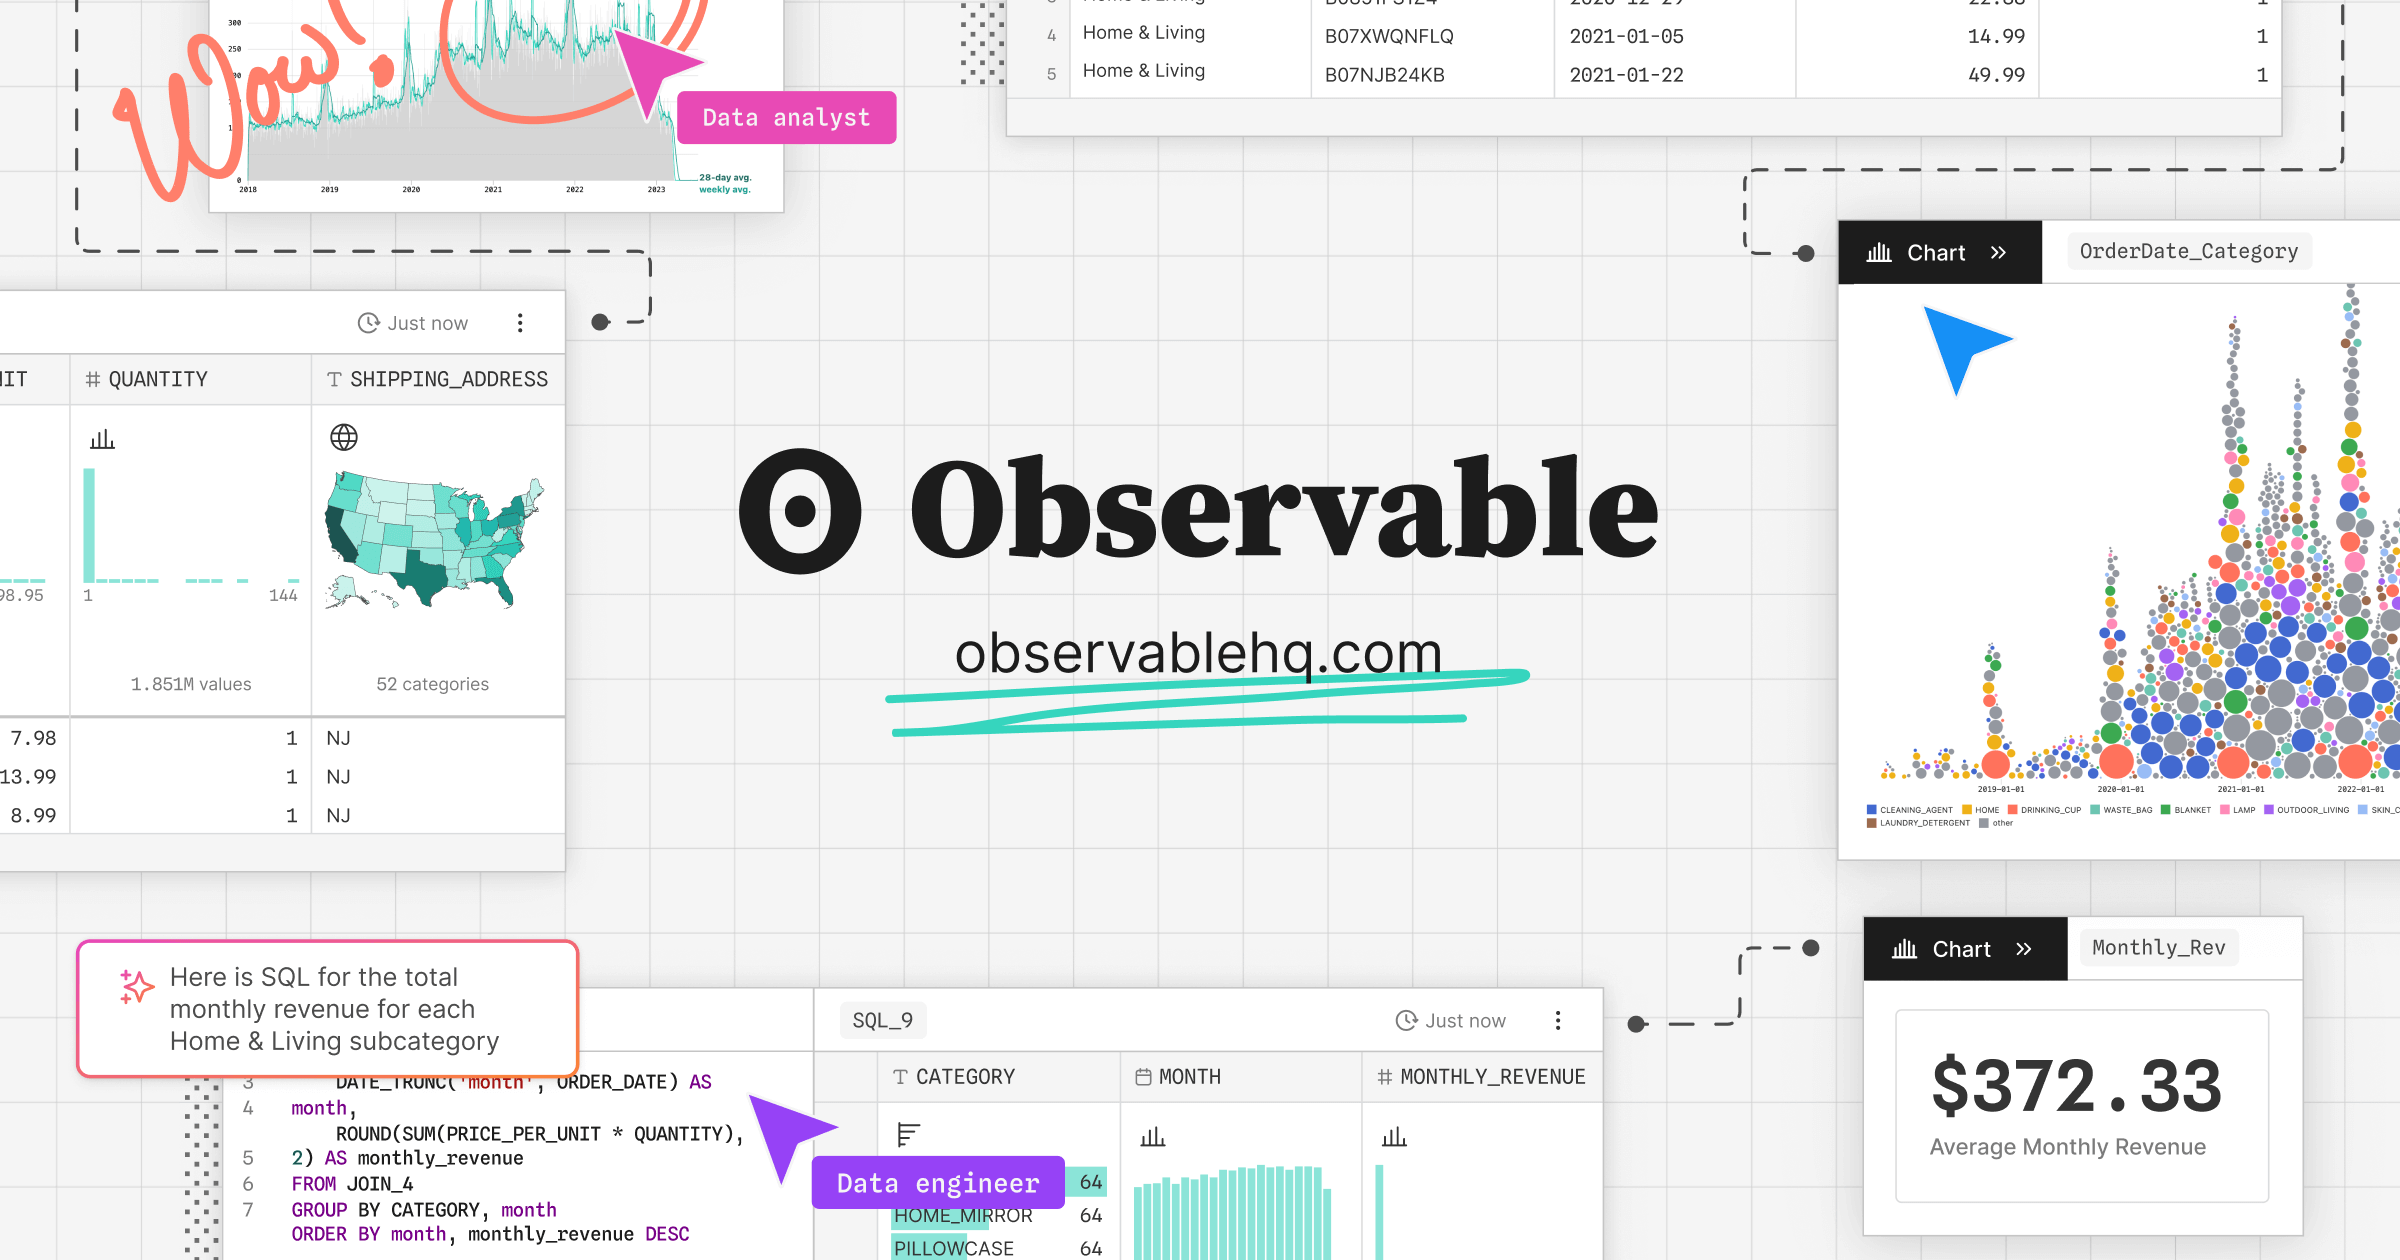
Observable is an all-in-one platform for data visualization with tools for developers, data analysts, and collaborators.
Mike has created 1,057 notebooks since 2022. Julio owns the record for the longest Duolingo streak without learning a word. Trevor, one of 800M chess players and 100M martial artists, aims to be the 0.01% to play full-contact chess. Seth has lived in cities from 0 to 8,392 feet above sea level. Hanna is on track to read 30 books this year. Paul has completed over 20 marathons and 10 ultramarathons. Michelle has explored 34 countries, logging over 13,600 hours of travel—all with just a carry-on. Erinn has 2 rabbits who eat over 1,400 cups of greens each year. Just another day to express my love of Observable Framework Observable Notebook Kit is such a joy to use. We are in love with @observablehq for all our #dataviz pieces 👩🏻💻 Getting more into @observablehq. I thought it was a kind of cool but now I realize it’s actually just AMAZING HOLY COW Observable opened up this whole new world of what we could offer people on such a short time scale... It expands the type of content we can create, and that we can offer our users. Observable lets us create polished, interactive, insightful visualizations without deep front-end expertise, making it essential for sharing our performance testing insights. 🤯 This is outstanding work by the Observable team! Connect data, code, charts, and powerful table components on the fly, visually, and effortlessly. All the piping complexity handled behind the scene. And then throw all that on an infinite multiplayer canvas with free form annotation. I feel like I’m staring at the future of BI! The UX of AI isn’t an interface, it’s visualizations and simulations. That’s why I’ve been keeping my eye on Observable. And now, their new Data Canvas changes the game, again. It’s all coming together. I use Observable for data dashboards at Tether and it rocks - and now they are out with a new data collaboration product called canvases, and it really rocks This is really, really incredible stuff. I can't wait to replace a bunch of terrible BI dashboards. I've seen and used so many amazing in-house dashboarding and reporting tools, and this suite blows them all out of the water.
Julius
Julius Business Plan
Loved by 2,000,000+ users and trusted by teams at Ask for what you want and Julius analyzes the data for you Connect with data sources like databases, spreadsheets, and more You provide the questions, Julius handles the analysis Choose from charts, tables or full reports tailored to your data From spreadsheets to databases, ask questions in natural language and get instant insights. Get context-rich analysis, connecting the dots between your different tools to see the full story. Your team can ask questions, generate reports, and share insights directly in Slack. Simply tag @Julius and ask. Set your schedule once, then get fresh reports delivered automatically every morning via Slack or Email. I’m big on data analysis (spreadsheets DAU!), but often find myself frustrated by errors and slowness in trying to even analyze a basic spreadsheet in ChatGPT. Julius is good at this, and has only gotten better over time. It’s both very reliable, and can generate helpful ideas for extra analysis as well as visualizations. AI Partner, Andreessen Horowitz Julius.ai completely changed how I approach growth. I can analyze multiple datasets at once and turn them into insights for customer acquisition, retention, and marketing campaigns, all without waiting on engineering or hiring data analysts. I’ve used it at two companies now, and it’s saved us hours while helping us make smarter decisions every day. Head of Growth, HomeFromCollege No coding or complex setup required. Turn your data into clear visuals that explain your findings. Ask questions for quick insights, or switch to R, Python, SQL for reproducible analysis. Gets better at understanding your data with every use, learning your business logic to surface relevant insights. Stop wasting time with tools that aren't optimized for data analysis. Use Julius and transform the way you analyze and visualize data. See how companies use Julius to transform their data analysis See how AthenaHQ cut data analysis time from a full day to under an hour with Julius. Discover how SpellBook cut 8–10 hours of manual data work every week down to minutes using Julius. Your data stays private and is never used to train AI. Julius is compliant with industry-leading standards including SOC 2 Type II, TX-RAMP, and GDPR. Balance sheet creation for a SaaS company Acquisition channel efficiency analysis Forecasting and inventory optimization Cash flow forecasting and budgeting Correlation matrix on genetic dataset With Julius, you can get the most out of your data.
Observable
Julius
Observable
Pricing found: $22/mo, $10/mo
Julius
Julius (1)
Only in Observable (4)
Only in Julius (10)
Observable


Julius
No screenshots
Observable
Julius